| Entry Point | Key Level | Projection | Stop Loss | |
|---|---|---|---|---|
| WTI Light Crude Oil | 107.77 (Buy) | 108.02, 108.24 | 110.54 | 107.47 |
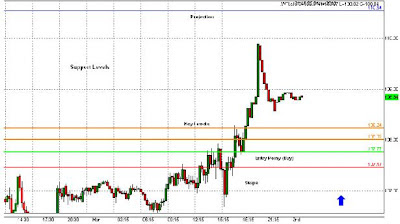
WTI Light Crude Oil Chart (15min) - Analysis time: (02:00 am)
Commentary
A Fibonacci Analysis on 15min WTI Chart. Gives us some support levels, a entry point at 107.77 and a projection of 110.54. I will also be looking at key levels, placing my stops beyond 107.47. Lets see how the market reacts to our levels.
Result:
WTI Light Crude Oil Chart (15min) - Result time: (21:50 pm)
Commentary
It was a successful trade for me as you can seen on the chart above, went long at 107.77(light blue circle) and came out at 108.30(on the trendline). Strategy is really important, like when to enter and exit, on a 15min timeframe you can always use 5min chart as a trigger chart. Once you've enter the trade then you can look at the news and make your decision whether to stay on or exit. To be on the safe side I prefer trading between the levels. Good Luck!.


No comments:
Post a Comment