| Entry Point | Key Level | Projection | Stop Loss |
|---|
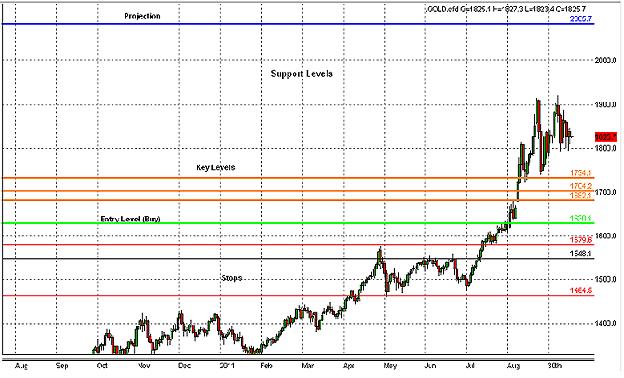
| Gold | 1725.2 (Sell) | 1671.6, 1684.4, 1692.4 | 1526.8 | 1758.0 |
|---|
Gold Chart (4 hour) - Analysis time: 00:21 am
Commentary
Fibonacci Analysis on a 4 hour Gold Chart. A selling oppurtunity at 1725.2, I will place my alarms around this entry point and key levels, to see whether the market tests these levels and bounce or break them. Projection is 1526.8. I will place the stops beyond the 1758.0 level and then adjust them accordingly. Lets see how the market behaves.
Update:
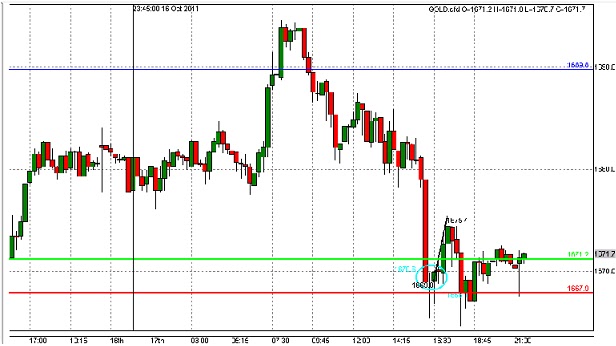
Gold Chart (4 hour) - Update time: 22:30 pm
Commentary
The market did retraced to one of our key levels. Market tested our first key level of 1671.6 and went to 1680 then a downtrend. Going short at 1671.6 (as circled on the chart above) would have given us good profit. The market is near 1590 at the moment so our levels our still intact at the moment. I will be waiting for the market to retrace to our other levels. I will be posting the result soon!!
Update:
Gold Chart (4 hour) - Update time: 23:40 pm
Commentary
The market bounced back from our key level of 1684.4, going short here would have been a good trade. I have circled the area on the chart above, its the second circle from the left side. Other levels are still intact!!
Update:
Gold Chart (4 hour) - Update time: 00:20 am
Commentary
The market has bounced from one of our key levels of 1692.4, this is the third time market has respected our level ( I have circled it on the chart above ). Going short at 1692.4 would have been a good trade. Our entry level of 1725.2 still holds.
Gold Chart (4 hour) - Result
COMING UP!!!