Tuesday 27 March 2012

Trade Alerts by Fibonacci - 27 Mar 2012 (00:00 am)


Entry PointKey LevelProjectionStop Loss
Gold1675.5 (Buy)1670.4, 1679.51703.61665.2


Gold Chart (15min) - Analysis time: (00:00 am)

Commentary
A Fibonacci Analysis on 15min Gold Chart. Gives us some support levels, a entry point at 1675.5 and a projection of 1703.6. I will also be looking at key levels, placing my stops beyond 1665.2. Lets see how the market behaves.

Tuesday 13 March 2012

Trade Alerts by Fibonacci - 13 Mar 2012 (18:20 pm)


Entry PointKey LevelProjectionStop Loss
S&P5001378.0 (Buy)1376.0, 1379.1, 1380.31391.11374.2


S&P500 Chart (15min) - Analysis time: 18:20 pm

Commentary
A Fibonacci Analysis on 15min S&P500 Chart. Gives us entry point at 1378, looking to go long here. Also observing the key levels. Will be placing the stops beyond 1374.2. Projection of 1391.1. Lets see how the market reacts to these levels.

Monday 12 March 2012

Trade Alerts by Fibonacci - 12 Mar 2012 (00:06 am)


Entry PointKey LevelProjectionStop Loss
Gold1704.8 (Buy)1706.8, 1708.91737.01698.4


Gold Chart (15min) - Analysis time: (00:00 am)

Commentary
A Fibonacci Analysis on 15min Gold Chart. Gives us some support levels, a entry point at 1704.8 and a projection of 1737.0. I will also be looking at key levels, placing my stops beyond 1698.4. Lets see how the market behaves.

Monday 5 March 2012

Trade Alerts by Fibonacci - 05 Mar 2012 (02:40 am)


Entry PointKey LevelProjectionStop Loss
CAC403477 (Buy)3483.9, 3490.73522.03468.3


CAC40 (15min) - Analysis time: 02:40 am

Commentary
A Fibonacci Analysis on 15min CAC40(France Stock Index) Chart. Gives us an entry level of 3477, will be looking to go long here with stops beyond 3468.3. Also observing the key levels. Our projetion is 3522. Lets see how the market reacts to our levels.

Friday 2 March 2012

Trade Alerts by Fibonacci - 02 Mar 2012 (02:00 am)


Entry PointKey LevelProjectionStop Loss
WTI Light Crude Oil107.77 (Buy)108.02, 108.24110.54107.47


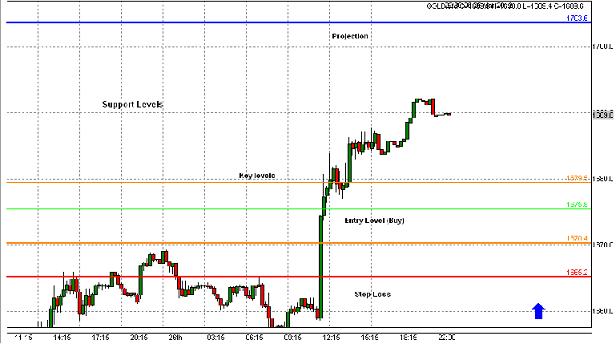
WTI Light Crude Oil Chart (15min) - Analysis time: (02:00 am)

Commentary
A Fibonacci Analysis on 15min WTI Chart. Gives us some support levels, a entry point at 107.77 and a projection of 110.54. I will also be looking at key levels, placing my stops beyond 107.47. Lets see how the market reacts to our levels.

Result:


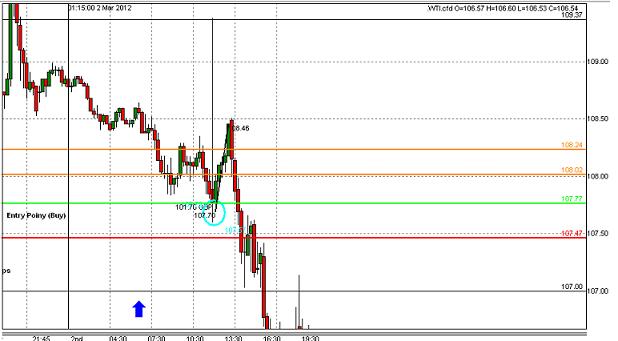
WTI Light Crude Oil Chart (15min) - Result time: (21:50 pm)

Commentary
It was a successful trade for me as you can seen on the chart above, went long at 107.77(light blue circle) and came out at 108.30(on the trendline). Strategy is really important, like when to enter and exit, on a 15min timeframe you can always use 5min chart as a trigger chart. Once you've enter the trade then you can look at the news and make your decision whether to stay on or exit. To be on the safe side I prefer trading between the levels. Good Luck!.