| Entry Point | Key Level | Projection | Stop Loss | |
|---|---|---|---|---|
| Gold | 1671.2 (Buy) | 1673.5, 1674.1, 1675.7 | 1689.8 | 1667.9 |

Gold Chart (15min) - Analysis time: 00:50 am
Commentary
Fibonacci Analysis on 15min Gold Chart. Gives us a entry at 1671.2 with three key levels to watch. Market is bullish at the moment but I will wait for the retracement then enter around 1671.2 placing my stops below 1667.9. Lets see how the market behaves to our Fibs.
Update:
The market has retraced to our Entry Level of 1671.2, a good oppurtunity to go long here.
Result:
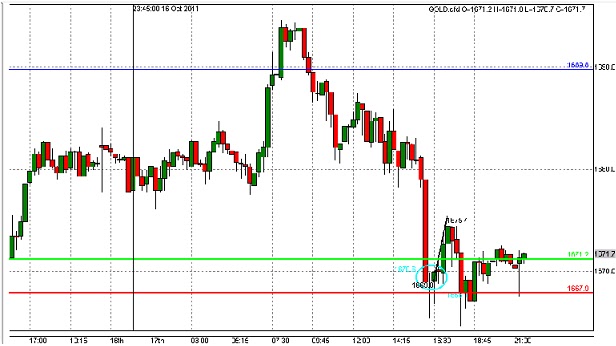
Gold Chart (15min) - Result time: 23:25 pm
Commentary
Well the market did retraced but tested our stop loss level. A good trade was possible as I have circled on the chart above. Using indicators at the right time and waiting for the market to comeback once it has tested or broken the level, is the key. Will be posting more trade alerts soon!!
No comments:
Post a Comment