| Entry Point | Key Level | Projection | Stop Loss | |
|---|---|---|---|---|
| Gold | 1675.5 (Buy) | 1670.4, 1679.5 | 1703.6 | 1665.2 |
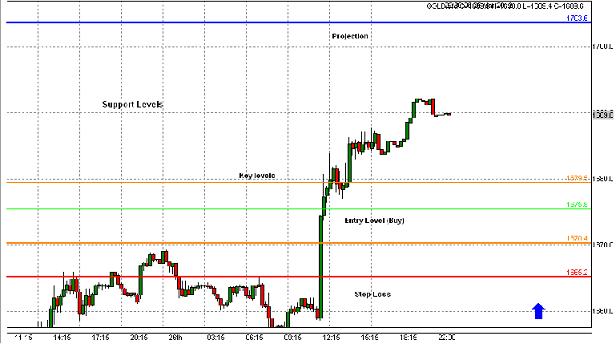
Gold Chart (15min) - Analysis time: (00:00 am)
Commentary
A Fibonacci Analysis on 15min Gold Chart. Gives us some support levels, a entry point at 1675.5 and a projection of 1703.6. I will also be looking at key levels, placing my stops beyond 1665.2. Lets see how the market behaves.
No comments:
Post a Comment