| Entry Point | Key Level | Projection | Stop Loss | |
|---|---|---|---|---|
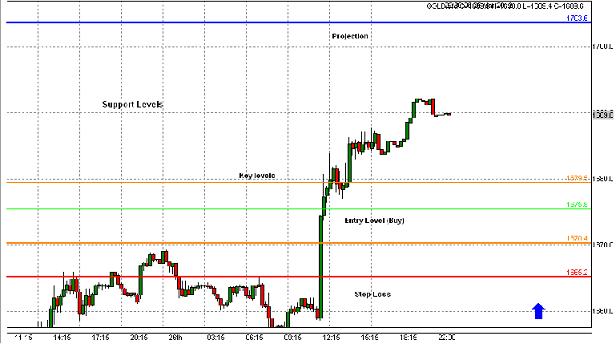
| Gold | 1601(Sell) | 1587.6, 1594.5 | 1563.5 | 1610 |

Gold Chart (1hour) - Analysis time: 00:00 am
Commentary
A Fibonacci Analysis on 1hour Gold Chart. Gives us an entry level of 1601, will be looking to go short here with stops beyond 1610. Also observing the key levels. Our projetion is 1563.3. The market has already broken our key levels, 1601 to 1606 looks like the the last resistance for Gold. Some fundamentals to look for next week are the China economy, Eurozone crisis and effect of Spain's financial sector bailout.