| Entry Point | Key Level | Projection | Stop Loss | |
|---|---|---|---|---|
| Gold | 1630.1 (Buy) | 1682.1, 1704.2, 1734.1 | 2085.7 | 1464.5, 1579.6 |
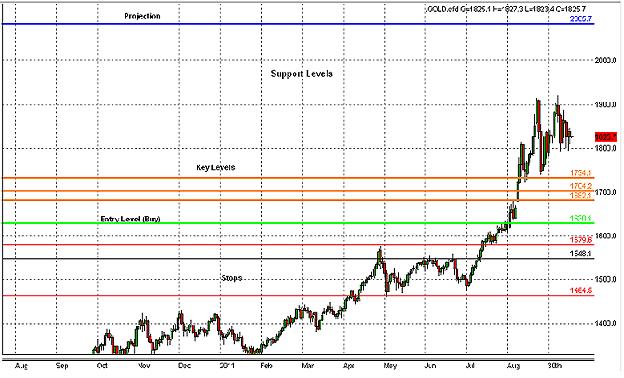
Gold Chart - Analysis time: 01:30 am
Commentary
Hello!, first time Fibonnaci grid on a daily chart, it gives us three key levels of support which we need to observe. I will wait till the market retraces to my main target zone which is 1630.1 where I will go long. Initially my stops will be beyond 1579.6 which I will move up accordingly. I will be posting trades on smaller time frame as always but result for this one I will be posting under this post. Lets see how the market reacts to these levels.
No comments:
Post a Comment