Wednesday 26 October 2011

Trade Alerts by Fibonacci - 24 Oct 2011 (00:40 am)


Entry PointKey LevelProjectionStop Loss
Gold1628.8 (Buy)1625.0, 1631.1, 1632.71654.31622.3


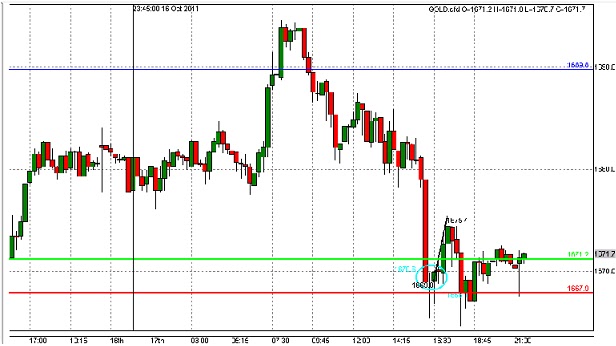
Gold Chart (15min) - Analysis time: 00:35 am

Commentary
Fibonacci Analysis on 15min Gold Chart. Gives us some support levels, a entry point at 1628.8 need to wait for a retracement. placing stops beyond 1622.3. I will observe to see what the market does at our key levels and use my indicators to make a decision. Lets see how the market behaves. I will be posting the result soon!

Update (26 Oct 2011 time: 00:58 am) :
The market never retraced but reached our Projection level and then steady for a while before escaping to new levels. Currently the market is around 1700, I will be looking at one of my previous posts of 3rd Oct 2011 which gives an entry point. Will be posting more trades soon!

Saturday 22 October 2011

Trade Alerts by Fibonacci - 21 Oct 2011 (00:50 am)


Entry PointKey LevelProjectionStop Loss
Gold1640.2 (Sell)1621.0, 1625.3, 1630.01600.21647.9


Gold Chart (15min) -  Analysis time: 00:50 am

Commentary
A Fibonacci Analysis on 15min Gold Chart gives us an entry level of 1640.2 to go short, I will be observing this level carefully and the key levels when the market retraces placing stops beyond 1647.9. Lets see how the market behave to our Fibs.

Result:


Gold Chart (15min) - Result time: 17:30

Commentary
The market did retraced breaking all our levels and testing the stop loss level. Going short near the stop loss level would have been a good trade as I have circled on the chart above. Will be posting more trades soon!

Monday 17 October 2011

Trade Alerts by Fibonacci - 17 Oct 2011 (00:52 am)

Entry PointKey LevelProjectionStop Loss
Gold1671.2 (Buy)1673.5, 1674.1, 1675.71689.81667.9


Gold Chart (15min) - Analysis time: 00:50 am

Commentary
Fibonacci Analysis on 15min Gold Chart. Gives us a entry at 1671.2 with three key levels to watch. Market is bullish at the moment but I will wait for the retracement then enter around 1671.2 placing my stops below 1667.9. Lets see how the market behaves to our Fibs.

Update:
The market has retraced to our Entry Level of 1671.2, a good oppurtunity to go long here.


Result:


Gold Chart (15min) - Result time: 23:25 pm

Commentary
Well the market did retraced but tested our stop loss level. A good trade was possible as I have circled on the chart above. Using indicators at the right time and waiting for the market to comeback once it has tested or broken the level, is the key. Will be posting more trade alerts soon!!


Friday 14 October 2011

Trade Alerts by Fibonacci - 03 Oct 2011 (00:15 am)


Entry PointKey LevelProjectionStop Loss
Gold1725.2 (Sell)1671.6, 1684.4, 1692.41526.81758.0


Gold Chart (4 hour) - Analysis time: 00:21 am

Commentary
Fibonacci Analysis on a 4 hour Gold Chart. A selling oppurtunity at 1725.2, I will place my alarms around this entry point and key levels, to see whether the market tests these levels and bounce or break them. Projection is 1526.8. I will place the stops beyond the 1758.0 level and then adjust them accordingly. Lets see how the market behaves.

Update:


Gold Chart (4 hour) - Update time: 22:30 pm

Commentary
The market did retraced to one of our key levels. Market tested our first key level of 1671.6 and went to 1680 then a downtrend. Going short at 1671.6 (as circled on the chart above) would have given us good profit. The market is near 1590 at the moment so our levels our still intact at the moment. I will be waiting for the market to retrace to our other levels. I will be posting the result soon!!

Update:

Gold Chart (4 hour) - Update time: 23:40 pm

Commentary
The market bounced back from our key level of 1684.4, going short here would have been a good trade. I have circled the area on the chart above, its the second circle from the left side. Other levels are still intact!!

Update:


Gold Chart (4 hour)  - Update time: 00:20 am

Commentary
The market has bounced from one of our key levels of 1692.4, this is the third time market has respected our level ( I have circled it on the chart above ). Going short at 1692.4 would have been a good trade. Our entry level of 1725.2 still holds.

Gold Chart (4 hour) - Result COMING UP!!!


Tuesday 11 October 2011

Update - 11 Oct 2011 (23:45 pm)

Looking at the 4hour Gold Chart that I posted on 03 Oct 2011. The market has bounced from our key level of 1684.4. This chart is still valid as the next resistance to look for is 1692.4 and 1725.2. Lets see how the market reacts!!

Monday 10 October 2011

Summary - 10 Oct 2011 (01:23 am)

The Gold Market was very much in our favour last week as it met our levels. On our last trade on 5min Gold Chart was quite successful as the market bounced from our entry level of 1626.5 going long to 1640, still rising. US jobs report was better than expected showing 103,000 jobs in september which gave lift to Wall Street while the downgrade of Spanish and Italian government debt by rating agency Fitch has undermined investor confidence. One of the Franco-Belgian bank Dexia, the first bank to fall victim to the debt crisis. The French and German leaders have met today to discuss the crisis issue and said that they were determined to do the necessary to ensure the recapitalization of Europe banks, they need between 100bn and 200bn euros to withstand the soveriegn debt crisis. This week news to watch is the ongoing eurozone crisis, this sovereign debt crisis will support the Gold prices this week. So more investors will be buying Gold but some analysts say that if the crisis in Europe continues and leads to recession then we could see prices going down. I will be looking at the 4hour Gold Chart that I had posted earlier in my recent posts, as I expect the market to rise and then see what it does around key levels. Will be posting more trade alerts soon!!

Saturday 8 October 2011

Trade Alerts by Fibonacci - 05 Oct 2011 (23:30 pm)


Entry PointKey LevelProjectionStop Loss
Gold1626.5 (Buy)1622.4, 1629.1, 1630.71655.41615.5


Gold Chart (5min) - Analysis time: 23:30 pm

Commentary
Fibonacci Analysis on a 5min Gold Chart. I will buy near 1626.5 and place my stops below 1615.5. Also observing the support at key levels. I expect the market to bounce from our entry level. I will also be looking at the 4hour Gold Chart levels from earlier post as they are still intact. Thanks!


Update:


Gold Chart (5min) - Update time: 18:14 pm

Commentary
The market has finally retraced to our entry level of 1626.5 and I will now use my indicators to make a decision to buy. Lets see how the market behaves. I will be posting the result soon.


Result:


Gold Chart (5min) - Result time: 00:15

Commentary
The market did bounced from our entry level at 1626.5. Going long at this point and coming out around 1640 was a good trade. Our levels on 4hour Gold Chart as posted earlier are still intact. Will be posting more trade alerts soon!