| Entry Point | Key Level | Projection | Stop Loss | |
|---|---|---|---|---|
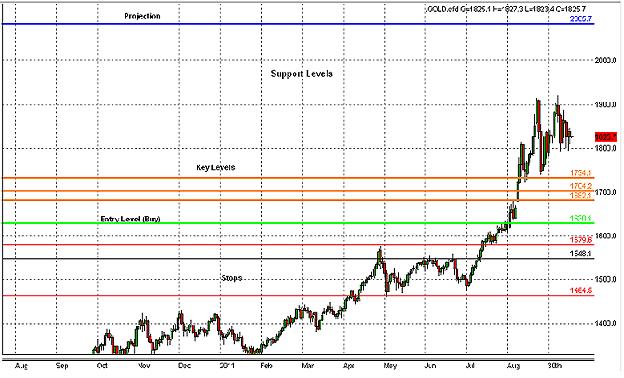
| Gold | 1619.8, 1624.4 (Sell) | 1615.6, 1630.9 | 1580.0 | 1638.3 |

Gold Chart (5min) - Analysis time: 19:30 pm
Commentary
Fibonacci Grid on a 5min Gold Chart, gives us a selling oppurtunity at two entry levels. Set alarms around the key levels and the first entry point 1619.8. When the market retraces to these levels only then use your indicators to enter the trade. Thanks!

Gold Chart (5min) - Result time: 23:35 pm
Commentary
Market did respected some of our levels. The market went close to our projection level then retraced big time. It broke all our resistance levels but tested 1630.9 key level was good place to go short(sell). I have circled the area on chart above. Patience is the key when trading with fibonacci levels, limit your loss on each trade. As Warren Buffet once said "Two golden rules, first rule, never lose your capital and second rule, never forget the first rule". More trade alerts soon!